

Nvidia Corp. dominates the coverage of the semiconductor industry, and will continue to do so as long as this company exceeds even its own expectations for sales and profits every quarter. But there are other semiconductor manufacturers that are also growing rapidly during this industry upcycle.
As shown below, investors who took a patient approach to investing in this sector group have done very well. But some investors will want to pursue shorter-term gains by selecting individual stocks. For these investors, it might help to screen a comprehensive list of semiconductor stocks to see which are favored by analysts working for brokerage firms.
Most read from MarketWatch
For traders: Semiconductor stocks appear ripe for a pullback: RenMac
A wide screen of semiconductor stocks
The initial list included 61 companies listed on U.S. exchanges, starting with the 30 in the PHLX Semiconductor Index SOX, which is followed by the iShares Semiconductor exchange-traded fund SOXX. From there, we added another 31 companies to the S&P Composite 1500 Index XX:SP1500 that operate in the semiconductor industry, as determined by FactSet, or in the Semiconductors and Semiconductor Equipment Global Industry Classification Standard group. The S&P Composite 1500 consists of the S&P 500 SPX, the S&P MidCap 400 MID and the S&P Small Cap 600 SML.
We then narrowed the list to 54 companies, followed by at least five analysts working for brokerage firms surveyed by FactSet.
We further narrowed the list to a dozen companies with at least 75% buy or equivalent ratings among analysts.
Here they are, sorted by implied upside potential for the next twelve months, based on consensus price targets:
|
Company |
Ticker |
Buy Ratings for Stocks |
Price June 21 |
Consensus price target |
Implied upside potential over twelve months |
Market capitalization ($mil) |
|
Semtech Corp. |
SMTC |
85% |
$30.14 |
$49.64 |
65% |
$1.9 |
|
Allegro MicroSystems Inc. |
ALGM |
100% |
$27.67 |
$35.38 |
28% |
$5.4 |
|
Ichor Holdings Ltd. |
ICHR |
100% |
$36.62 |
$46.60 |
27% |
$1.2 |
|
Marvell Technology Inc. |
MRVL |
91% |
$71.89 |
$89.75 |
25% |
$62.2 |
|
Advanced Micro Devices Inc. |
AMD |
80% |
$161.23 |
$190.02 |
18% |
$260.6 |
|
SiTime Corp. |
ZITM |
86% |
$118.60 |
$139.17 |
17% |
$2.7 |
|
On to Innovation Inc. |
ON |
83% |
$216.40 |
$253.00 |
17% |
$10.7 |
|
Micron Technology Inc. |
MU |
89% |
$139.54 |
$159.17 |
14% |
$154.5 |
|
Broadcom Inc. |
AVGO |
86% |
$1,658.63 |
$1,879.79 |
13% |
$772.1 |
|
First Solar Inc. |
FSLR |
78% |
$258.87 |
$283.76 |
10% |
$27.7 |
|
Taiwan Semiconductor Manufacturing Co. ADR |
TSM |
95% |
$173.96 |
$176.73 |
2% |
$902.3 |
|
Nvidia Corp. |
NVDA |
90% |
€126.57 |
$128.33 |
1% |
$3,113.6 |
|
Source: FactSet |
||||||
Despite a 90% buy or equivalent rating, the consensus price target for Nvidia NVDA is only 1% higher than Friday’s closing price.
Here’s recent coverage of some analyst calls regarding the stocks mentioned above:
Now let’s take a look at how valuations have changed for the group of the top 12 semiconductor stocks. Here are comparisons of forward price-to-earnings ratios and price-to-sales ratios as of Friday’s close and a year earlier. The ratios for the iShares Semiconductor ETF and the SPDR S&P 500 ETF Trust SPY are at the bottom.
|
Company |
Ticker |
Forward price-to-earnings ratio |
Forward price-to-earnings ratio a year ago |
Price/sales ahead |
Future price/sales one year ago |
Price change from twelve months to June 21st |
|
Semtech Corp. |
SMTC |
28.1 |
26.6 |
2.0 |
1.5 |
26% |
|
Allegro MicroSystems Inc. |
ALGM |
45.0 |
27.9 |
6.3 |
7.2 |
-33% |
|
Ichor Holdings Ltd. |
ICHR |
35.6 |
33.2 |
1.3 |
1.2 |
1% |
|
Marvell Technology Inc. |
MRVL |
40.0 |
32.0 |
10.2 |
8.6 |
22% |
|
Advanced Micro Devices Inc. |
AMD |
35.9 |
32.3 |
9.0 |
7.2 |
44% |
|
SiTime Corp. |
ZITM |
107.9 |
221.3 |
13.1 |
15.0 |
1% |
|
On to Innovation Inc. |
ON |
37.9 |
25.8 |
10.6 |
6.0 |
104% |
|
Micron Technology Inc. |
I |
18.6 |
n/a |
4.4 |
3.6 |
112% |
|
Broadcom Inc. |
AVGO |
29.6 |
19.2 |
13.6 |
9.4 |
96% |
|
First Solar Inc. |
FSLR |
15.1 |
18.8 |
5.5 |
4.9 |
40% |
|
Taiwan Semiconductor Manufacturing Co. ADR |
TSM |
25.4 |
17.7 |
8.4 |
6.2 |
71% |
|
Nvidia Corp. |
NVDA |
41.4 |
50.4 |
22.9 |
22.9 |
194% |
|
iShares Semiconductor ETF |
SOXX |
29.5 |
22.8 |
7.1 |
5.2 |
53% |
|
SPDR S&P 500 ETF Trust |
SPY |
21.1 |
18.9 |
2.8 |
2.4 |
25% |
|
Source: FactSet |
||||||
Looking first at the bottom of the table, last year was a year of impressive performance for the S&P 500, with Nvidia and other tech stocks having an outsized impact. SOXX has more than doubled the price change of the S&P 500 over the past twelve months.
Keep in mind that price-to-earnings ratios can be distorted if a company is only marginally profitable or focuses so much on growing its business that little revenue flows to the bottom line. For Micron Technology Inc. MU, there was no forward price-to-earnings ratio a year ago because at that time the rolling twelve-month EPS estimate was negative.
It’s interesting to see that Nvidia’s forward price-to-earnings ratio is lower than it was a year ago, even though its share price has almost tripled. This shows that the rolling 12-month EPS estimate has risen even faster than the share price. Looking at future price-to-sales ratios, Nvidia’s is the highest in the S&P 500. High expectations are baked into that stock price. And Nvidia’s price-to-sales ratio is quite close to its price-to-earnings ratio, which indicates how high the profit margins are for its graphics processing units, or GPUs. The company continues to dominate this part of the sector as data centers install the units as quickly as possible to support enterprise customers’ efforts to create new products and services that use generative artificial intelligence.
More about rising stocks with falling price/earnings ratios: Nine popular stocks, including Nvidia, that have become more attractive on this crucial metric
Looking further ahead
Over the long term, a beat-and-raise pattern can support rising stock prices. Analysts estimate companies’ quarterly sales and profits, and after companies announce their results, which may include changing their own expectations for the coming quarters, analysts will follow suit by updating their estimates.
For Nvidia, it’s difficult to gauge results in what still appears to be the new industry of using GPUs to support AI. But the analysts keep trying. Here you will find the expected compound annual growth rates for revenue and earnings per share for the same group of twelve companies for the next two calendar years. The 2026 estimates are available to all except Semtech Corp. SMTC and Micron, while a 2026 revenue estimate is available for Broadcom Inc. AVGO. We used consensus estimates as adjusted by FactSet from calendar 2024 through calendar 2026 because some companies have fiscal years that don’t match the calendar.
At the bottom of the table are the expected CAGRs for the PHLX Semiconductor Index and the S&P 500. Below are some notes on the data.
|
Company |
Ticker |
Projected two-year revenue CAGR through 2026 |
Projected two-year CAGR per share through 2026 |
|
Semtech Corp. |
SMTC |
N/A |
N/A |
|
Allegro MicroSystems Inc. |
ALGM |
14.0% |
38.8% |
|
Ichor Holdings Ltd. |
ICHR |
9.8% |
142.2% |
|
Marvell Technology Inc. |
MRVL |
24.2% |
50.3% |
|
Advanced Micro Devices Inc. |
AMD |
23.2% |
43.3% |
|
SiTime Corp. |
ZITM |
27.7% |
89.6% |
|
On to Innovation Inc. |
ON |
15.2% |
31.6% |
|
Micron Technology Inc. |
MU |
N/A |
N/A |
|
Broadcom Inc. |
AVGO |
11.3% |
N/A |
|
First Solar Inc. |
FSLR |
22.0% |
47.3% |
|
Taiwan Semiconductor Manufacturing Co. ADR |
TSM |
18.0% |
21.8% |
|
Nvidia Corp. |
NVDA |
26.1% |
26.5% |
|
PHLX Semiconductor Index |
SOX |
12.4% |
22.7% |
|
S&P500 |
SPX |
5.8% |
13.2% |
|
Source: FactSet |
|||
There are no estimates available for Semtech for calendar year 2026. The consensus among analysts surveyed by FactSet is that the company’s revenue will increase 19% in calendar year 2025, with earnings per share increasing 143%.
For Micron, analysts expect revenue to rise 35% in 2025, while earnings per share will rise 173%.
For Broadcom, the table shows an expected two-year revenue CAGR of 11.3% through 2026, but no EPS estimate is available for 2026. For 2025, EPS is expected to grow 24% will rise.
Market extras: Why are some AI stocks lagging while Nvidia is on a chip rally in 2024?
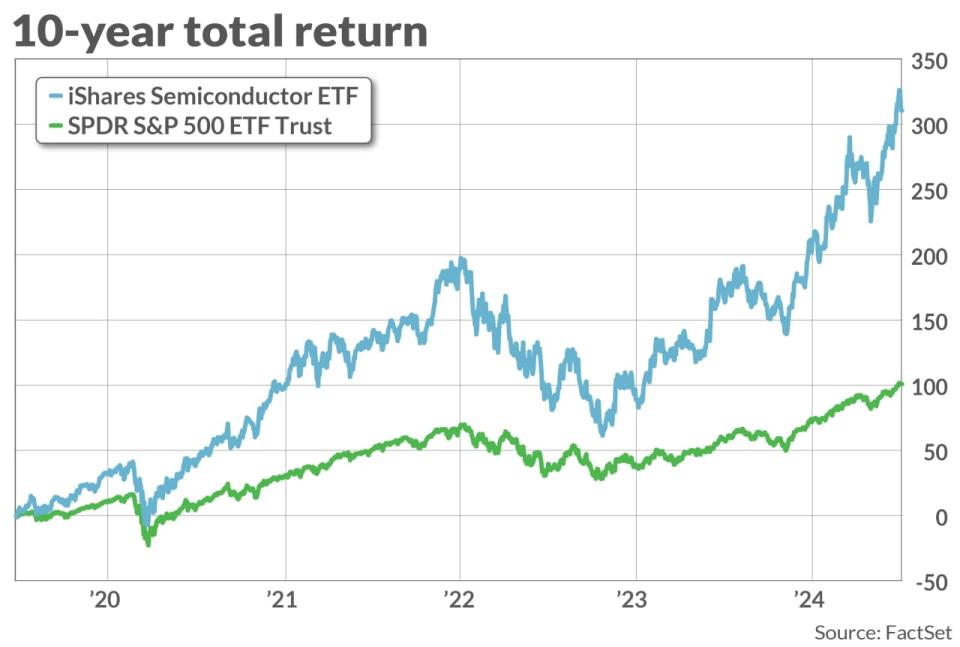
Looking back through up/down cycles
Take a look at this five-year total return chart for SOXX versus SPY, with dividends reinvested. It not only shows that the semiconductor group is performing excellently, but also how volatile these stocks can be. In 2022 – a bad year for the stock market – SPY fell 18%, but SOXX fell 35%.
Can you sustain these difficult cycles for a number of years? If so, limiting some of your portfolio allocation to semiconductors may be worth it in the long run.
You should do your own research to form your own opinion before making any investment. One way to get started is by clicking on the tickers of a company, ETF or index above.
Click here for Tomi Kilgore’s detailed guide to the wealth of information available for free on MarketWatch’s quotes page.
Do not miss it: Nine popular stocks, including Nvidia, that have become more attractive on this crucial metric
 & Pistons Hire JB Bickerstaff | Good Word with Goodwill")


