

There is increasing evidence that “Tornado AlleyAccording to a recent study of tornado formation patterns, the area of the United States most prone to tornadoes is shifting east.
‘Tornado Alley’ is an acronym that typically describes the central Plains region of the United States, but according to the study, published in April in the Journal of Applied Meteorology and Climatology, parts of the eastern US are now facing the ‘ largest tornado’. threat.” Tornado activity is now much more likely to impact the Midwest and Southeast, the study said.
The shift has been going on since 1951, the study found, which used information from two different data sets, each spanning 35 years, to determine where and when tornadoes formed. The study looked at tornadoes rated F/EF1 or stronger. (A tornado is considered EF1 on the Enhanced Fujita Scale if its wind gusts are estimated at 80-110 mph, based on the amount of damage. The scale ranges from EF0 to EF5 for the most damaging tornadoes.)
Maps of patterns of tornadogenesis, or the process by which a tornado forms, show that tornado formation peaked in northern Texas, Oklahoma and Kansas between 1951 and 1985.
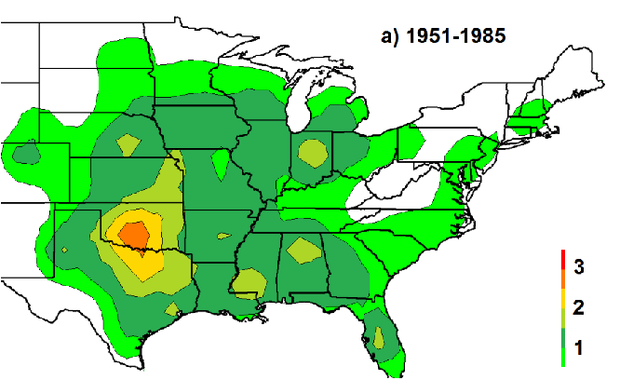
Coleman, Thompson and Forbes, 2024, JAMC. © American Meteorological Association. Used with permission. This preliminary version has been accepted for publication in the Journal of Applied Meteorology and Climatology and may be cited in full. The final formatted, copied article will replace the EOR when published.
Another map shows that tornadogenesis peaked in Mississippi, Louisiana and Alabama between 1986 and 2020. Such events also increased further east, including Virginia, West Virginia, and Pennsylvania.
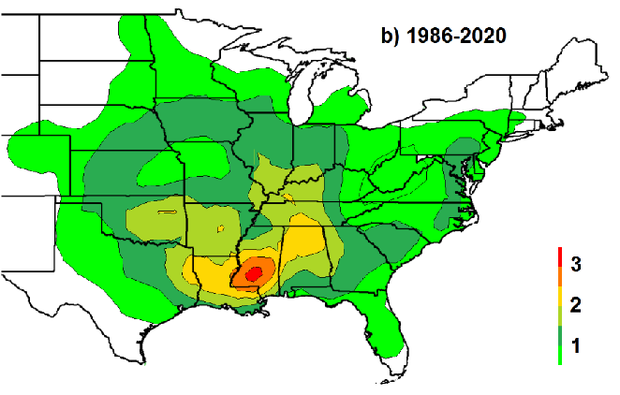
Coleman, Thompson and Forbes, 2024, JAMC. © American Meteorological Association. Used with permission. This preliminary version has been accepted for publication in the Journal of Applied Meteorology and Climatology and may be cited in full. The final formatted, copied article will replace the EOR when published.
The number of tornadoes in the western part of the country fell 25% between those two periods, from more than 8,450 tornadoes between 1951-1985 to just over 6,300 between 1986-2020, the study found. During that same time, tornado activity in the eastern United States increased 12%, from over 9,400 tornadoes between 1951-1985 to over 10,500 tornadoes between 1986-2020.
And it’s not just the regions that are changing, the research shows: tornadoes are increasingly occurring in colder weather. Earlier this year, Wisconsin saw one tornado in Februarya first for the state.
Multiple deadly tornadoes have hit the U.S. this year, especially in the Plains and Midwest. NOAA has confirmed 39 tornado-related deaths this year, including eight in both Texas and Oklahoma. Wednesday a 2 year old was killed when a tornado in Michigan caused a tree to fall on a house.
There was also damage seen in Maryland Wednesday from what may be the strongest tornado to hit the D.C. metro area since 1996.
CBS News senior weather producer David Parkinson said late May is typically a very busy time for tornadoes, but explained that climate change can cause severe storms to occur more often.
“We can’t call a tornado something related to climate change in any way, but we can say that the pattern of things increasing and getting stronger is probably related to a warming world,” Parkinson said.


